Measuring On-Shelf Availability

A British retailer, focused on own label businesses, including food, clothing, home and food products, in the UK and internationally required the support of RGIS. The retailer operates a family of businesses, selling high-quality, great value own-brand products in the UK and in 62 countries, from 1,519 stores and 44 websites globally. The British retailer have over 950 UK stores, with over 650 having a full food offering.
REQUIREMENT
The retailer wanted to measure and track the on-shelf availability (OSA) of the food offering across all categories on a trending basis, and use that information to drive better supply into stores and replenishment routines.
The retailer required RGIS to provide the following:
- National coverage
- Unannounced audits at stores
- Monthly visits to be completed
- Identify gaps in food offering at different times of the day
SOLUTION
The retailer partnered with RGIS to complete the on-shelf availability project, and RGIS provided the following:
- Experienced RGIS auditors visited all the retailer’s food stores on a monthly basis
- At different times of day (morning, noon and afternoon) on a rolling basis to scan all items on the food display on the shop floor
- Where there was no product on the shelf, then the shelf edge label was not scanned
- The accurate reports produced by RGIS were compared in program to the expected range file of that specific store
- Lines not scanned produced a report of ‘not available lines’, which were then followed up by the RGIS team, who looked for the missing inventory in the stockroom
- If missing items were found, these were recorded as ‘in store, but not available to customer’ on the report
- Lines not found at all were classed as ‘out of stock’
RESULTS
The retailer found by outsourcing the on-shelf availability project to RGIS, the following results were achieved:
- The final report was shared with the retailer which gave an accurate percentage availability per category for each store, and this classed store availability as red, amber or green per trading category
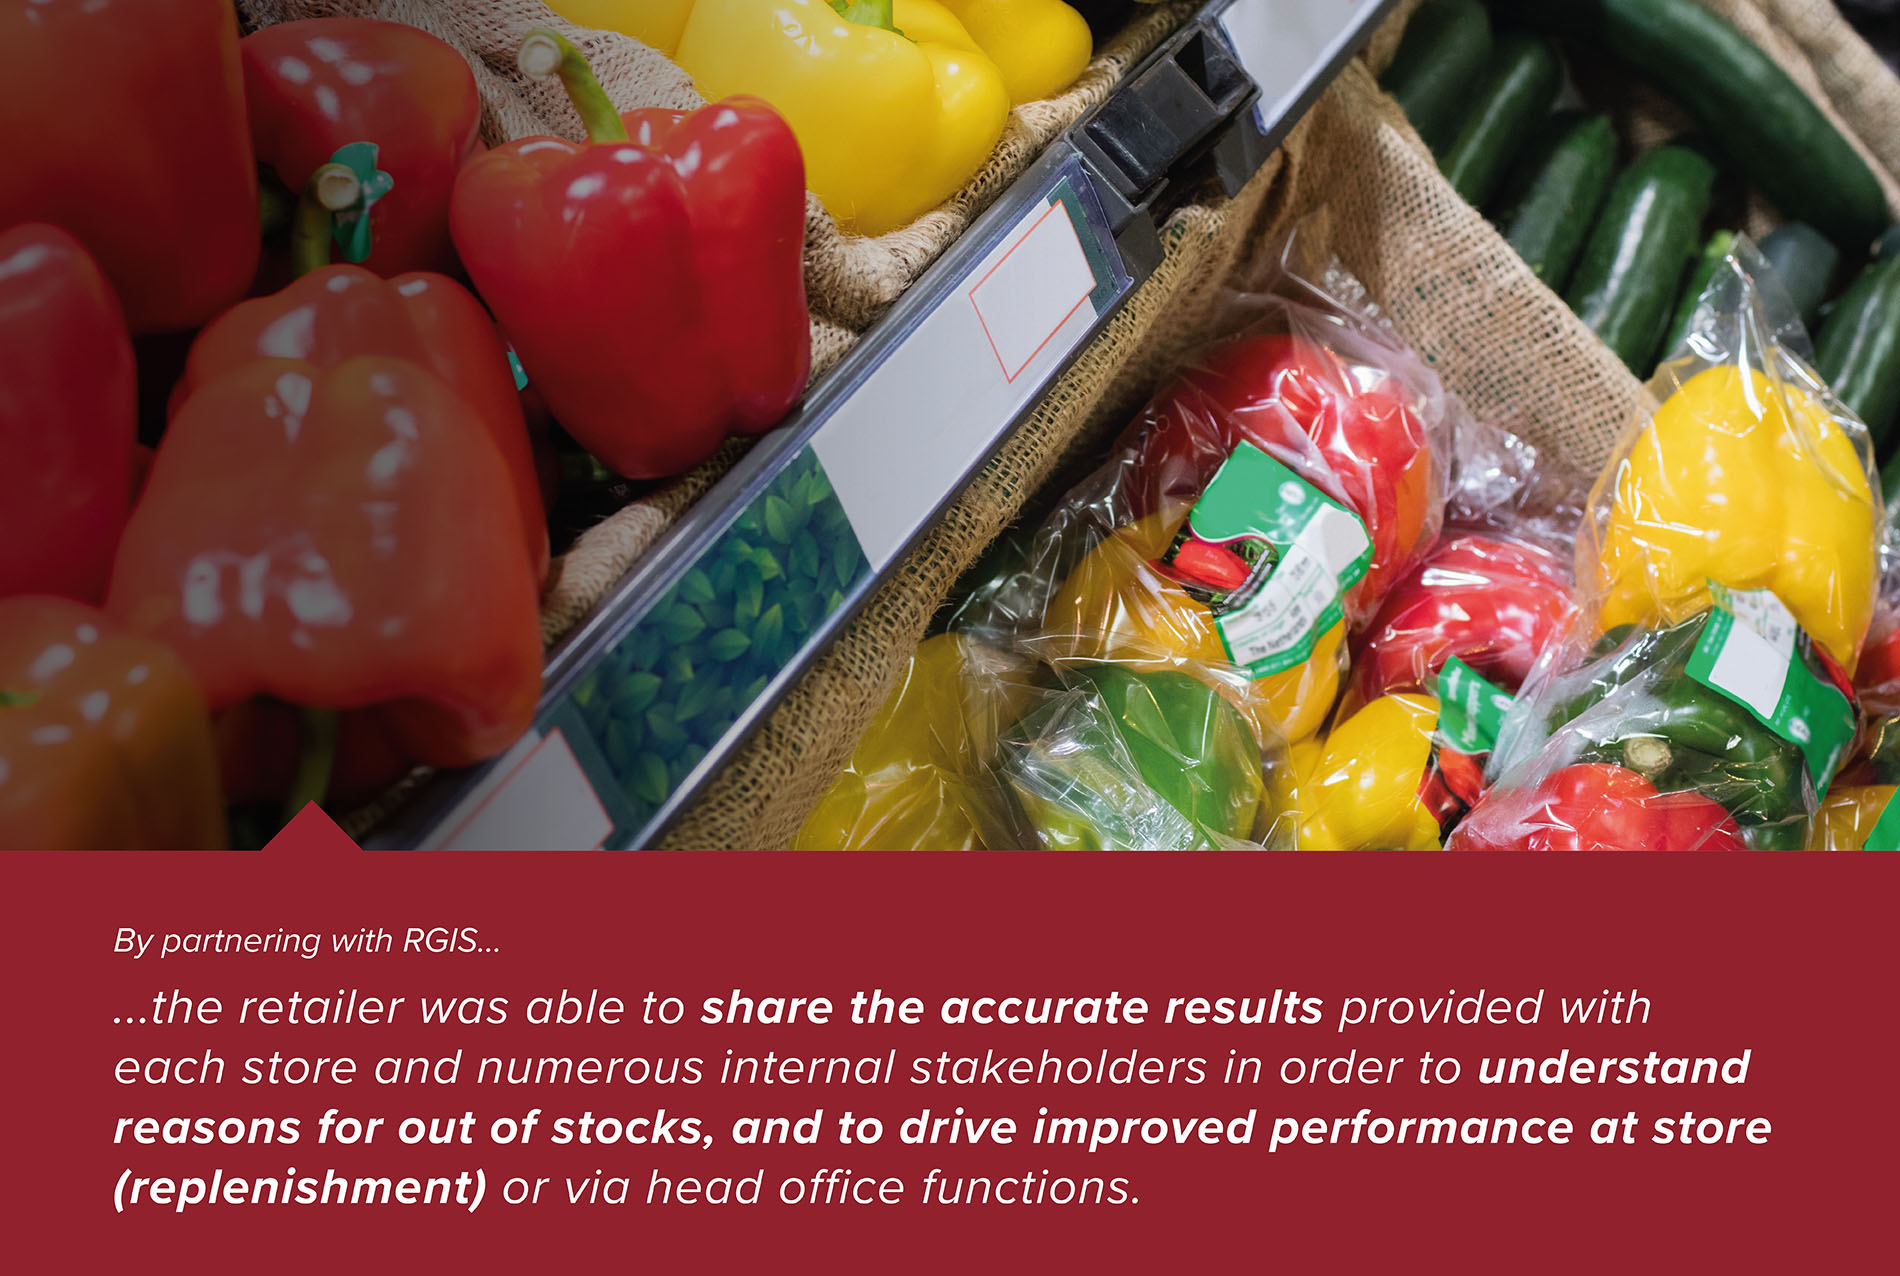
- Results were shared with each store and numerous internal stakeholders, in
order to understand reasons for out of stocks and to drive improved performance at store (replenishment) or via head office functions (buying, merchandising, supply chain and logistics)